:: Customizing Code Coverage ::
Before beginning this session, if you are new to code coverage, let's have a quick overview.
What is Code Coverage?
Code coverage is the means of being able to track which part of the application code has been exercised during an activity. In Microsoft Dynamics NAV, code coverage is recorded by C/AL code line and specifies if a code line was exercised by the activity and the number of times the line of code was executed.
How to open Code Coverage?
path: /Departments/Administration/Application Tools
click here open Code Coverage directly.
How to Start Code Coverage Monitoring?
Before beginning your process open Code Coverage window and click Start. "This starts the code coverage engine, and code coverage is captured. However, you will not be able to see any updated information until you choose Refresh or Stop. The information contains coverage of objects, triggers and functions, and individual lines of code or empty lines as determined by the column Line Type. Only lines of type Code can have coverage. Lines of type Trigger/Function show the average coverage of all code lines in the trigger or function. Lines of type Object show the average coverage of all code lines inside the object." Complete your process execution and reopen Code Coverage window and click STOP to end code coverage engine.
Now the fun part. . ..
Let's try to export this data precisely, only the code lines which were executed during the capturing process.
I have created a very basic report with DataItem as Code Coverage. Deatiled as below,
You can download this report from here: Code Coverage Report
Now as the code is avaialble in Microsoft Excel, we can do several advance functions like groupping, filtering, text search or even do pivot charts as per our analysis requirment.
1. Run Code Coverage Report and export the Coverage lines as mentioned above for the first NAV instance.
2. Repeat the same step for second instance you want to compare with.
3. You may not be familiar with Microsoft Spreadsheet Compare tool, it is an inbuilt tool comes with Microsoft Office. If you have Microsoft office, you can look up into your system from start menu by searching keyword “Spreadsheet Compare” (in Cortana for Windows 10) or open directly from “C:\Program Files (x86)\Microsoft Office\Office16\DCF\ SPREADSHEETCOMPARE.EXE”
5. After opening the files, Click on Resize Cells to Fit action.
6. Click on Options and tick Process cell contents in inserted rows/columns.
7. Remove Structural comparison if not required. Option available on Bottom left.
8. Check comparison results (bottom middle section) click any row to highlight the change line.
What is Code Coverage?
Code coverage is the means of being able to track which part of the application code has been exercised during an activity. In Microsoft Dynamics NAV, code coverage is recorded by C/AL code line and specifies if a code line was exercised by the activity and the number of times the line of code was executed.
How to open Code Coverage?
path: /Departments/Administration/Application Tools
click here open Code Coverage directly.
How to Start Code Coverage Monitoring?
Before beginning your process open Code Coverage window and click Start. "This starts the code coverage engine, and code coverage is captured. However, you will not be able to see any updated information until you choose Refresh or Stop. The information contains coverage of objects, triggers and functions, and individual lines of code or empty lines as determined by the column Line Type. Only lines of type Code can have coverage. Lines of type Trigger/Function show the average coverage of all code lines in the trigger or function. Lines of type Object show the average coverage of all code lines inside the object." Complete your process execution and reopen Code Coverage window and click STOP to end code coverage engine.
Now the fun part. . ..
Let's try to export this data precisely, only the code lines which were executed during the capturing process.
I have created a very basic report with DataItem as Code Coverage. Deatiled as below,
You can download this report from here: Code Coverage Report
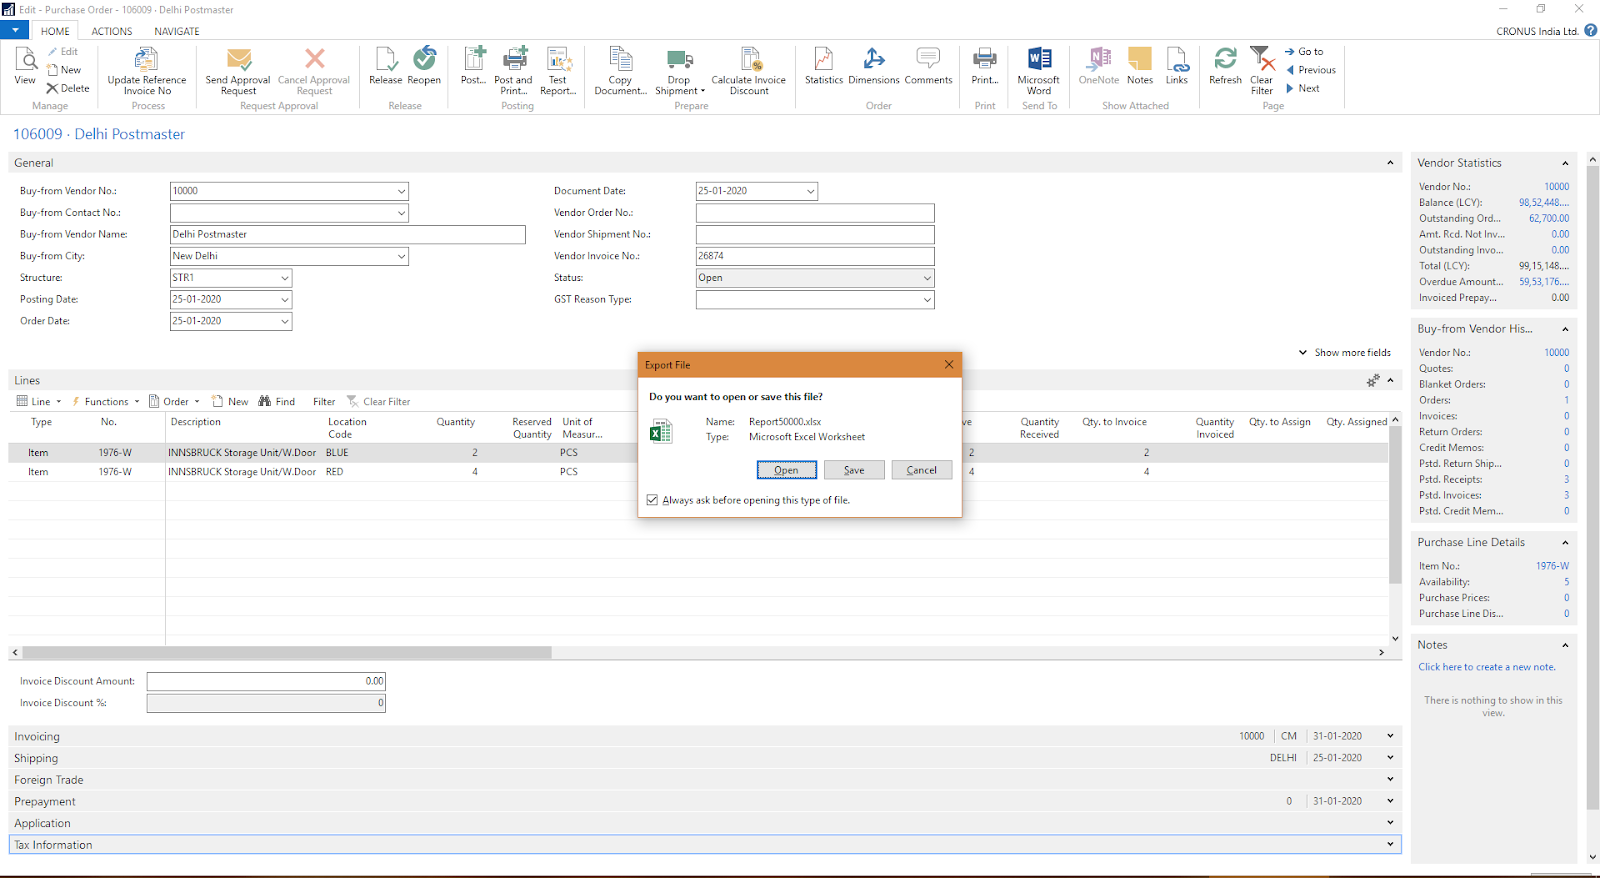
Save and compile the report and Run it from Object explorer. Make sure if you completed Code Coverage process before this. Run this report and save the output as Microsoft Excel.
Advance Analysis:
Now the next section is only for advance analysis. You can export multiple Code Coverage session data as mentioned above. Scenarios like where you have to compare code execution flow in 2 different NAV versions, different Cummulative Updates or different localized databases, this will definitely help.1. Run Code Coverage Report and export the Coverage lines as mentioned above for the first NAV instance.
2. Repeat the same step for second instance you want to compare with.
3. You may not be familiar with Microsoft Spreadsheet Compare tool, it is an inbuilt tool comes with Microsoft Office. If you have Microsoft office, you can look up into your system from start menu by searching keyword “Spreadsheet Compare” (in Cortana for Windows 10) or open directly from “C:\Program Files (x86)\Microsoft Office\Office16\DCF\ SPREADSHEETCOMPARE.EXE”
4. Select the desire files (created in step 1 & 2) you want to compare by clicking Compare Files action in ribbon. Click OK.
5. After opening the files, Click on Resize Cells to Fit action.
6. Click on Options and tick Process cell contents in inserted rows/columns.
7. Remove Structural comparison if not required. Option available on Bottom left.
8. Check comparison results (bottom middle section) click any row to highlight the change line.


Great, tx!
ReplyDeleteThis comment has been removed by a blog administrator.
ReplyDelete