:: Optimizing Code Coverage Page ::
As a Dynamics NAV developer, we all are familiar with this
veteran tool for code tracking, The Code Coverage. This tool is very different from debugging as
we don’t halt the transaction or process with breakpoints. It simply track all
the codes executed during its capturing process from start to stop. It tracks all
the code lines and count the line hit during the execution.
In Dynamics NAV previous versions like 2009 SP1 & 2009 R2 it
was a great tool for developers to fix calculation issues which doesn't cause runtime error, Third party tool integrations
or Tracking codes for developing new functionality in a module.
It feels gloomy to realize how this tool has lost its usability in
recent versions. Recently I encountered G/L CONSISTENCY error in a transaction
which is nothing but a calculation traggic in one of G/L entry. I tried debugger but unfortunately it
didn’t work for me. Then I recalled, our this old friend but when it introduced to its
new GUI, I was completely shattered. . ..
 |
| Code Coverage Page SetStyles Function |
Now the Code Coverage page is
more convenient for code readability but our job is not done yet. . ..
Up Next on Part 2 >>
1. Fixing Export to Excel.
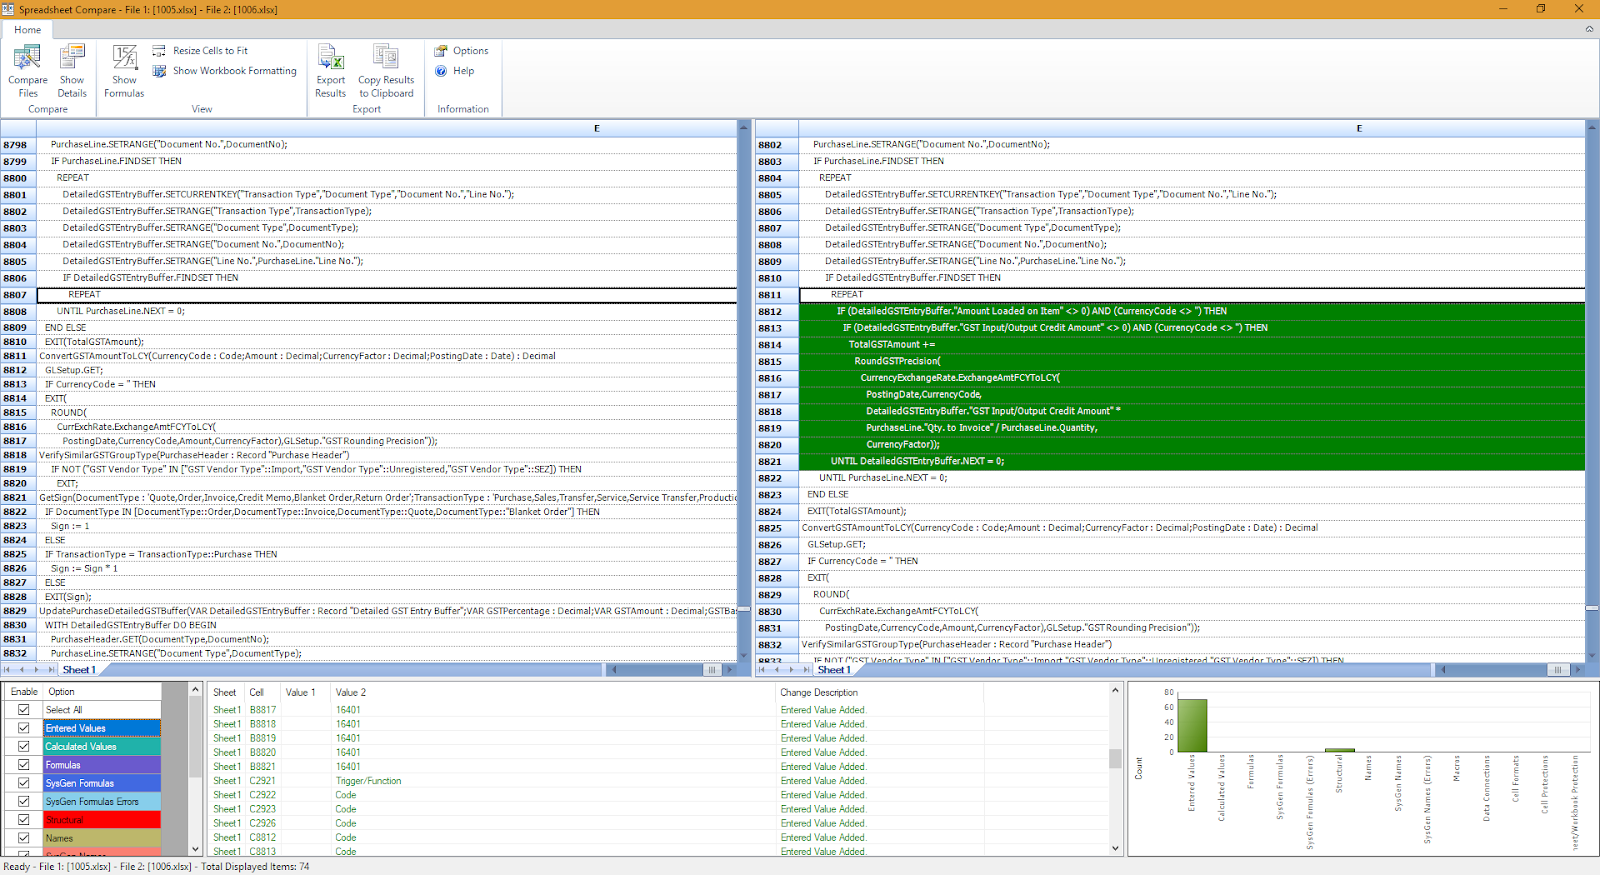
2. Comparing Coverage lines from multiple sessions.
 |
| Comparing Coverage lines from multiple sessions preview |


Good Job Mrinal :)
ReplyDeleteThanks John :)
DeleteGood Job Mrinal:)
ReplyDeleteThanks Naveen :)
DeleteKacklappen. Das macht jeder student besser und schneller
ReplyDeleteThis comment has been removed by a blog administrator.
ReplyDelete